User Guide
Introduction
As mentioned in the general description of the plugin, this tool helps to determine which routes are the best and safest for mobile monitoring teams based on computed statistics concerning the gamma radiation dosage.
Firstly, the plugin extracts dose rate values from a given interpolated map on vertices of a given route. Then computations are made, briefly it is cumulative dosage on each segment (between two neighbor vertices) calculated from the length of the segment and the speed, that is given by the user. Then it is the time interval on each segment and the cumulative time on every vertex of the route.
Also new point layer (Shapefile) is created. It contains vertices of the given route with data from the computation in the attribute table. Same data are added to CSV file, that is optionally created.
The most important output of the plugin is the text report file, that contains final statistics of the route, such as length, travel time, maximal dose rate value etc. (will be described in next section.)
It is important to mention, that results of the computation, especially those, that are dealing with the gamma radiation dose, are estimates. The reason of this is, that the calculations only use few of variables, that are dealing with this problematics. For example it does not concern the situation on roads, weather (wind, rain..) etc.
Sampling the track
The distance between track vertices can be very large, especially on sections, that are straight (e.g. highways). If there is any kind of peak or any significant change of dose rate value on these long straight parts of track, it is not recognized because of the stated reason. Hence the plugin samples the track to smaller parts and allows user to choose the length of them.
GUI
The plugin is divided into two tabs. The first of them is Main tab:
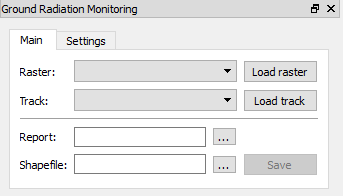
Figure 1: The main tab of plugin.
- In main tab, the user may select a raster layer with the interpolated map of dose rate values. He may select a vector layer with a route. Both of those layer could be selected using combo boxes, which include available layers from the Layer panel. There is a restriction for the track combo box, that only the layer with a linestring type is being shown.
- Plugin also allows user to upload files with raster and vector layers
via buttons
Load rasterandLoad track. With hitting one of these buttons, a file dialog appears. Only GDAL/OGR supported files are shown. - A tool button
...that followsReportline lets the user to select a destination, where the report file will be saved. Then the blank space in the same line is filled with the path to selected destination file with .txt suffix. Also the blank space in theShapefileis automatically filled with the same path with a different suffix (.shp instead of .txt). - The destination of the created shapefile could be changed with hitting
a tool button
...onShapefileline. - Finally,
Savebutton does all the work, it starts the computation and saves created files to selected destinations.
The second tab of the plugin is Settings tab:
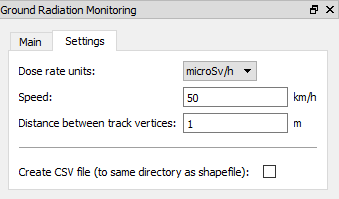
Figure 2: The settings tab.
- This tab allows the user to change input variables.
Dose rate unitscombo box sets the units of gamma radiation dose rate values of the interpolated map.Speedvalue determines what speed the mobile team is driving. This value has to be given.Distance between track verticesvalue is used for sampling the track. If this value is not given, the track will not be sampled.Create CSV filecheckbox gives the user an option, whether to create CSV file with the same data, that are written to created shapefile.
- Settings tab is filled with values by default.
Input data
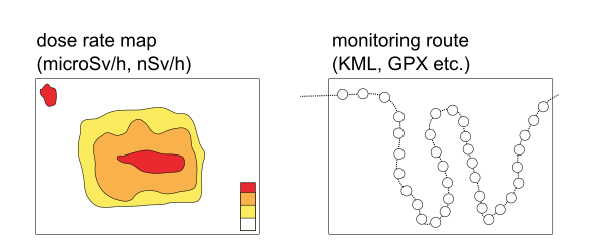
Figure 3: Input files.
- An interpolated map of dose rate values with a format supported by GDAL library.
- A monitoring linestring route with a format supported by OGR library.
Output data
- A text report file containing fields:
- time, when was the report created;
- route information - name, monitoring speed, total monitoring time, total distance;
- information about the part of the track, that has no data available (where the track exceeds the raster) - time, distance;
- estimated radiation values - maximum and average dose rate, total dose;
- plugin settings - input raster units, distance between track vertices.
- a static text explaining the report
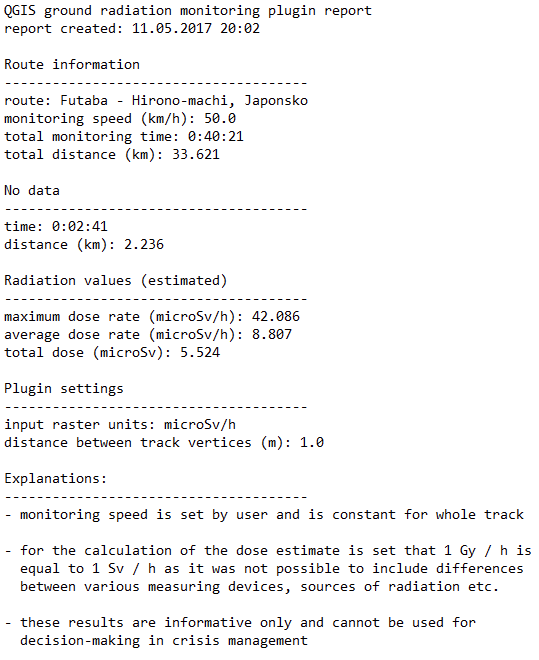
Figure 4: The report file.
- A shapefile with point layer counting vertices of a sampled route with following attributes - dose rate, cumulated time, time interval from previous point, cumulated dose.
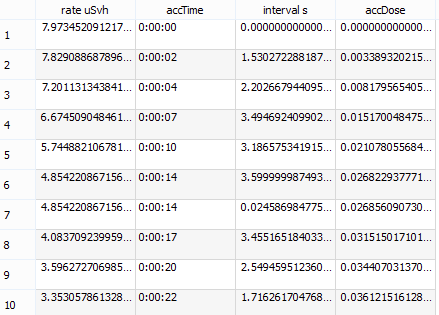
Figure 5: The attribute table.
- An optional CSV file with same values as in created shapefile.
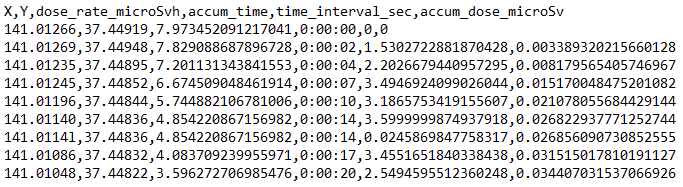
Figure 6: The CSV file.